Inference Cost vs Agent Reliability: Why 85 Failed Runs Beat My…
Inference cost vs agent reliability: 85 failed runs out of 13,069 cost me more than the entire inference bill. Here is what I attack first now.
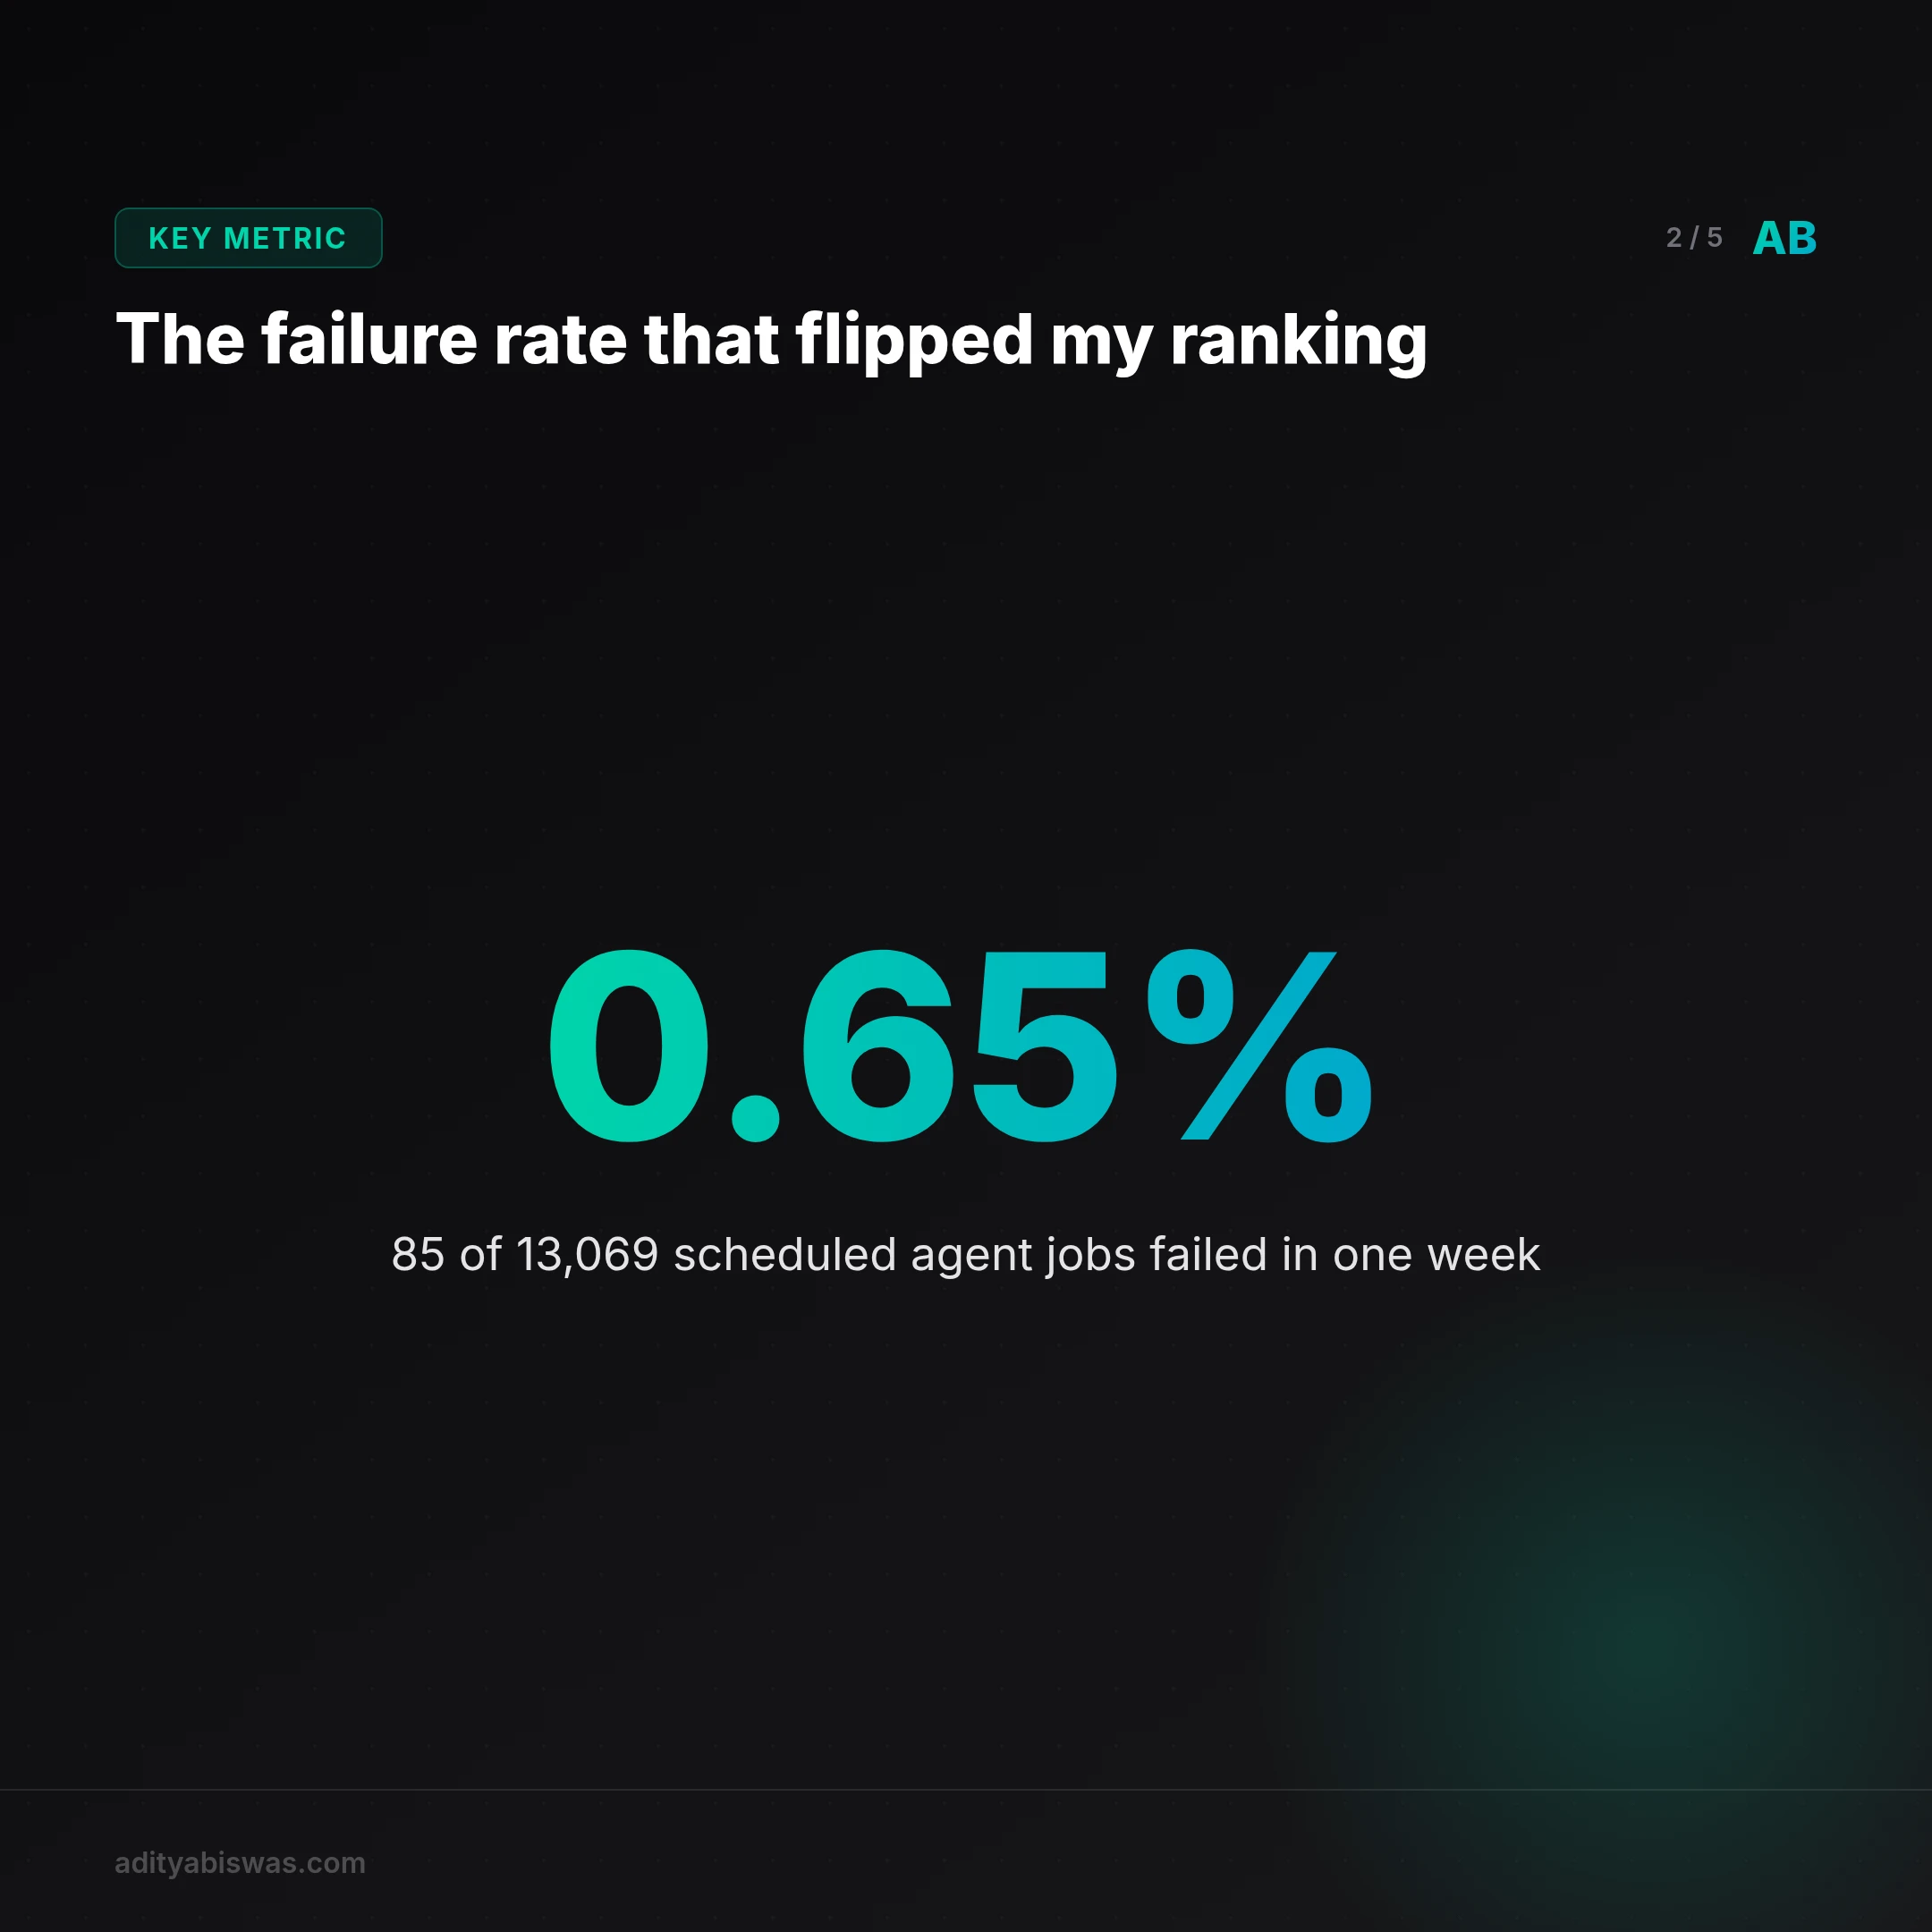
Last week my scheduler ran 13,069 agent jobs. Eighty-five of them failed. That is a failure rate of about 0.65%, and for most of the week I did not care, because my provider dashboard showed a small number and I was busy shipping. Then I sat down and priced the failures properly, and the ranking flipped. The money I lose to broken runs is bigger than the money I lose to token price. Every founder optimising inference cost vs agent reliability is looking at the wrong column first 1.
The 0.65% that actually costs money
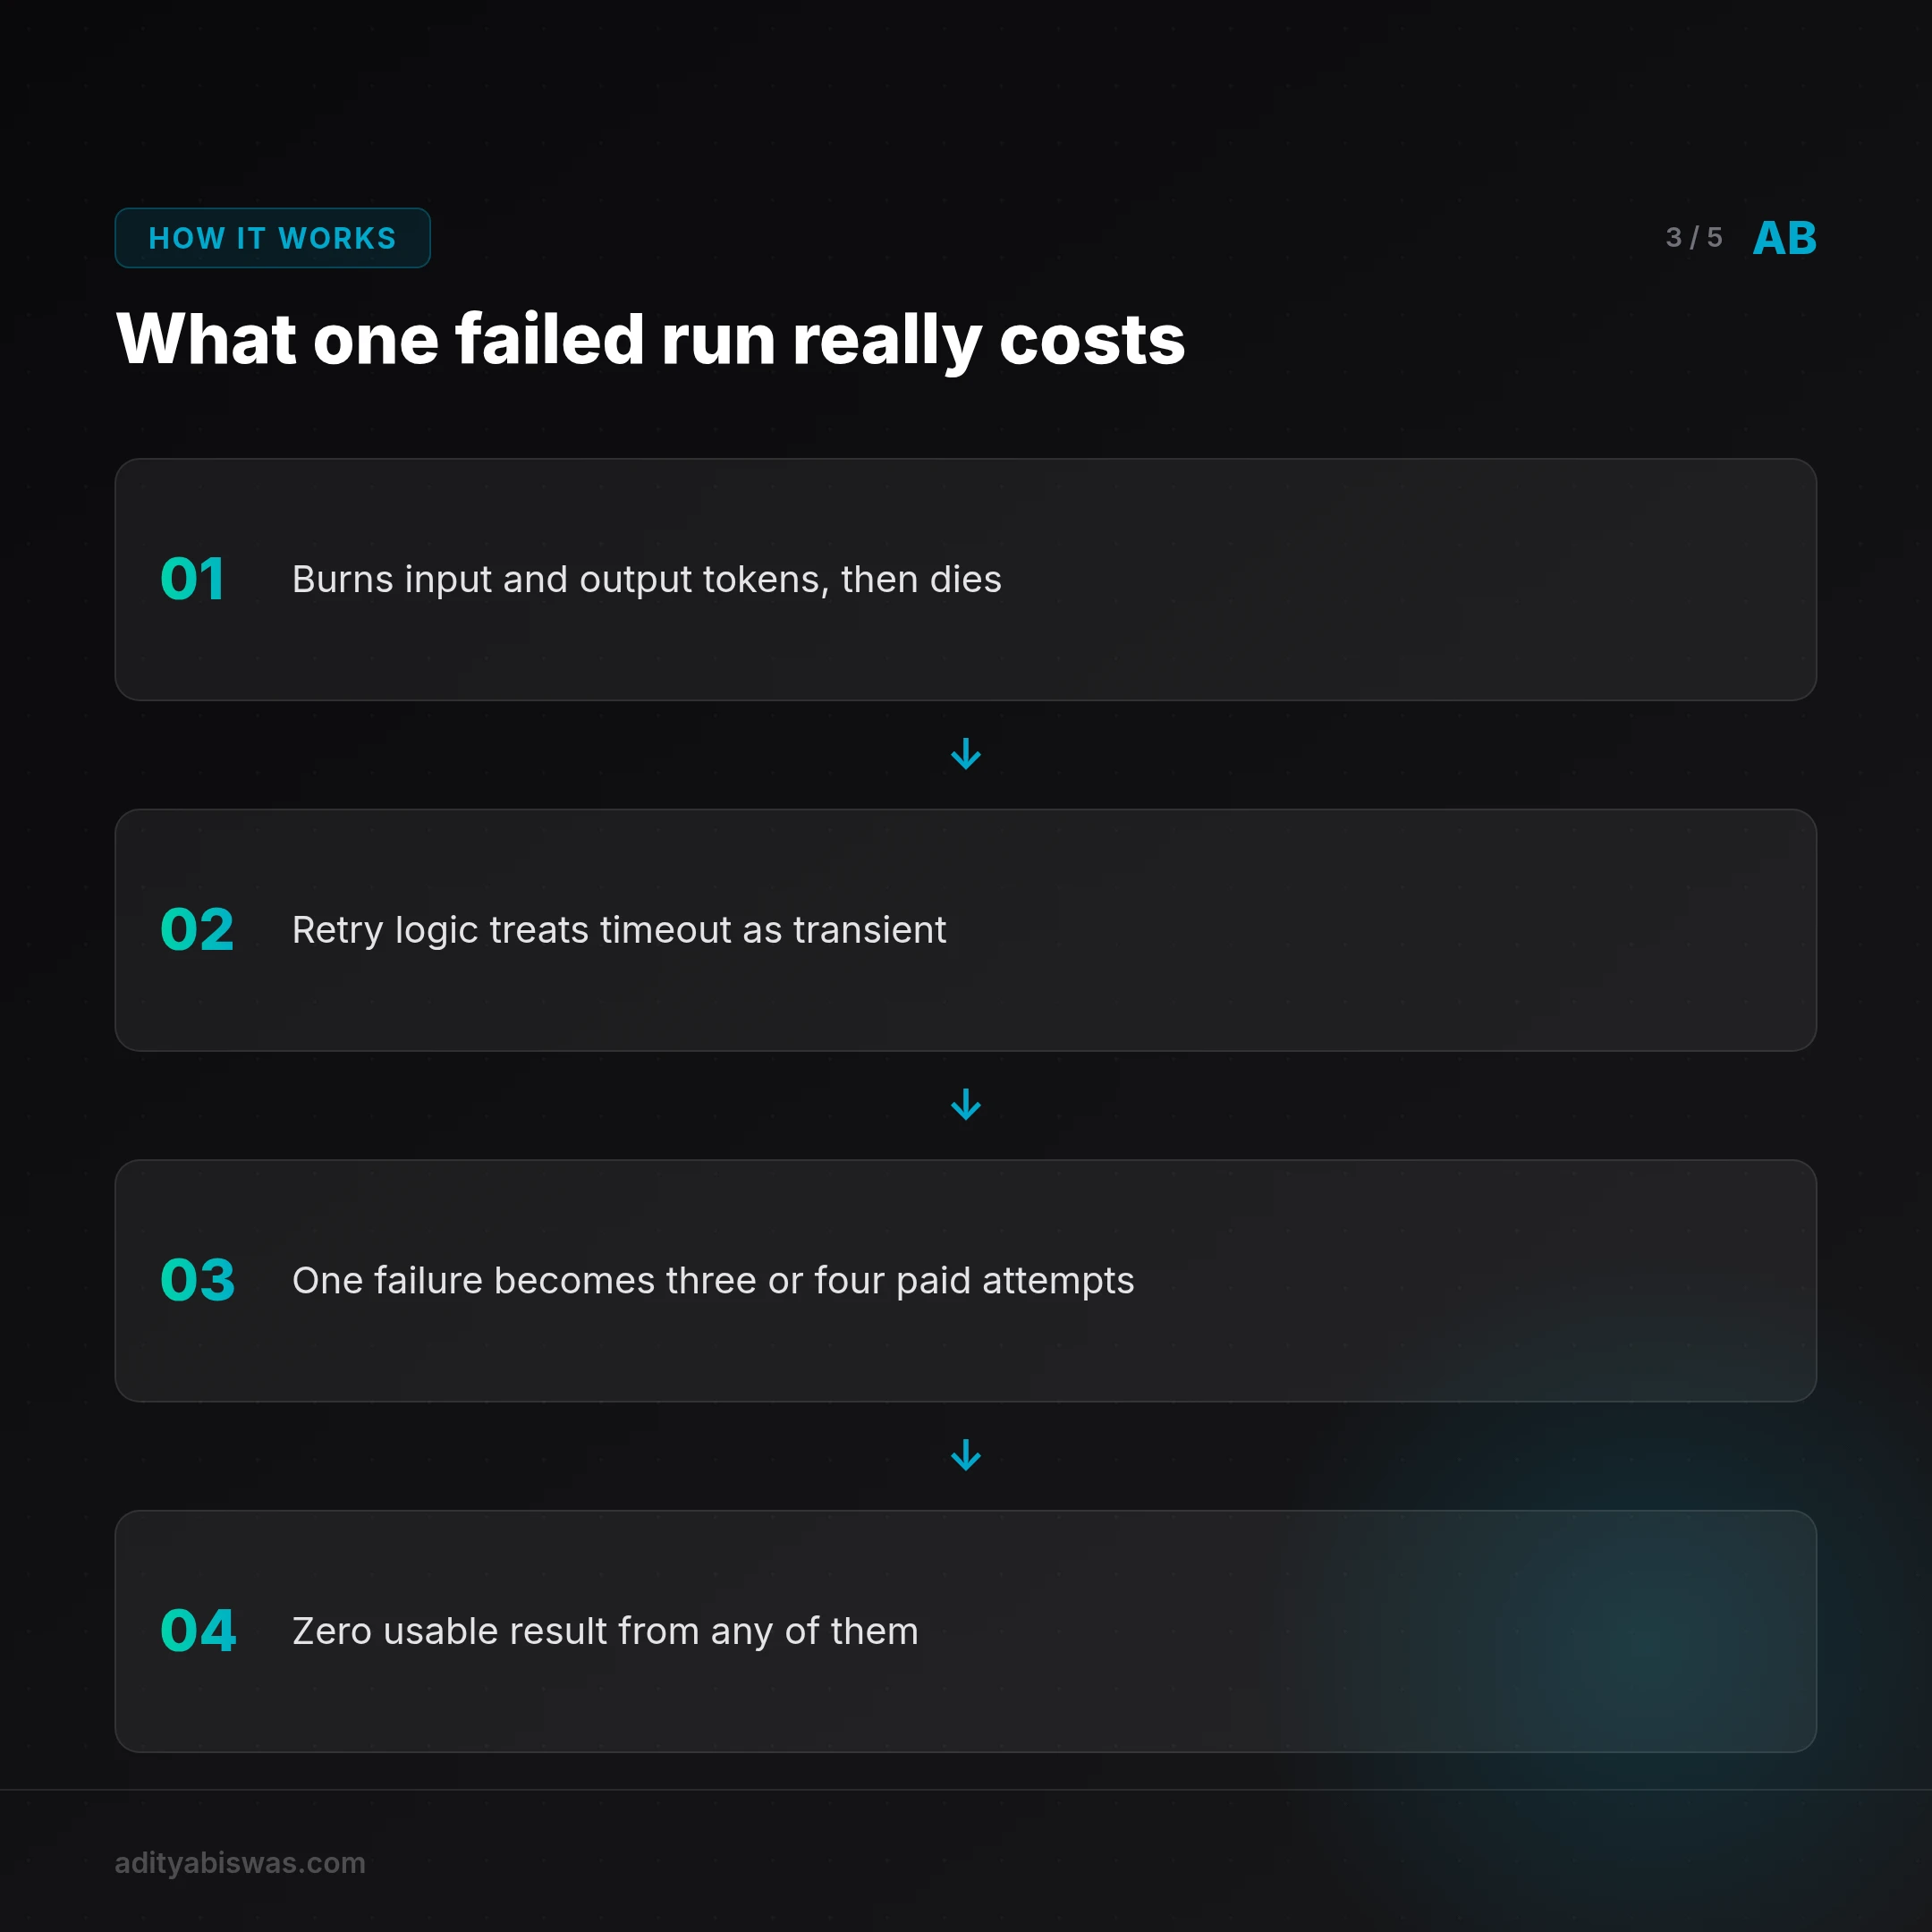
Here is the arithmetic that changed my mind. A failed scheduled run is not one wasted call. It is a call that burned input tokens, probably some output tokens, and then died before it did the thing. Then it retries. Then it retries again, because the retry logic I wrote treats a timeout as transient. So one failure becomes three or four paid attempts, and none of them produce a result I can use.
That is the part the pricing-per-million-tokens table never shows you. A source focused on AI agent economics makes the same point: the metric that matters is cost per successful task, not raw inference spend 1. Divide your bill by successful completions instead of total calls and the picture changes. My failures were cheap individually and expensive in aggregate, because each one paid full price for zero outcome.
There is a second cost that does not appear on any invoice. A failed cron job at 03:00 IST means something downstream is missing when I wake up. A draft that never got written. A sync that never ran. I then spend the morning reconstructing state by hand instead of building. That is the real line item, and it is measured in hours, not rupees.
Failed runs are not a rounding error on your inference bill. They are a separate bill you are not reading.
The failure rate itself is not alarming. Roughly two-thirds of one percent sounds healthy, and it is, until you remember that a solo operator has no on-call rotation. Every one of those 85 failures landed on the same person who wrote the retry logic, the scheduler, and the prompt.
Why token price is the wrong first lever
In my experience, most agent frameworks I have touched ship some kind of cost page. Cheap tiers, cached prompts, batching, quantised models, spot capacity. I use all of it. I pin cheap tiers for routine work and pay for a strong reasoning model only where it changes the outcome, because cost discipline is an architecture and not a line item.
But notice what that buys me. If I halve my token price, the bill halves. If I cut my failure rate from 0.65% to 0.1%, the bill drops by roughly the same amount, and I also stop losing mornings. The second lever pays twice.
The published work on this is mostly about large platforms, and it still points the same direction. An empirical study of real production incidents in AI inference services frames reliability as a correctness problem rather than an availability one: your uptime number tells you whether the service responded, not whether the response was trustworthy 23. If that is true for a platform with an SRE team, it is more true for a scheduler running unattended on one box.
There is a hardware angle I want to flag honestly, because I cannot test it. I suspect that for teams running their own GPUs, a lot of what eats their week is hardware failure rather than model quality, and that much of their traffic never touches a commercial API 45. I have no GPU, so I will not pretend to have opinions about node-level failures I have never seen. What I can say is that the failure taxonomy is similar in shape: the expensive failures are the quiet ones.
Optimising token price is a one-time win. Fixing reliability compounds every week you leave the scheduler running.
What I actually changed this week
Three things, all boring, all cheap.
First, I made failures loud. Store operations now raise instead of swallowing a bad write. I learned this the hard way when a newsletter persisted 1 of 9 editions for weeks because a write ate its own error and returned success. Silent failure is the enemy of a system you leave running, and a scheduler is exactly that system.
Second, I wrote a reaper. It reconciles stuck state rather than letting it accumulate: blocked issues, rows with a NULL project id, orphan drafts that no run will ever claim. The reaper runs on the same cron as everything else and reports what it found. Most weeks it finds nothing. The weeks it finds something, it saves me an hour of archaeology.
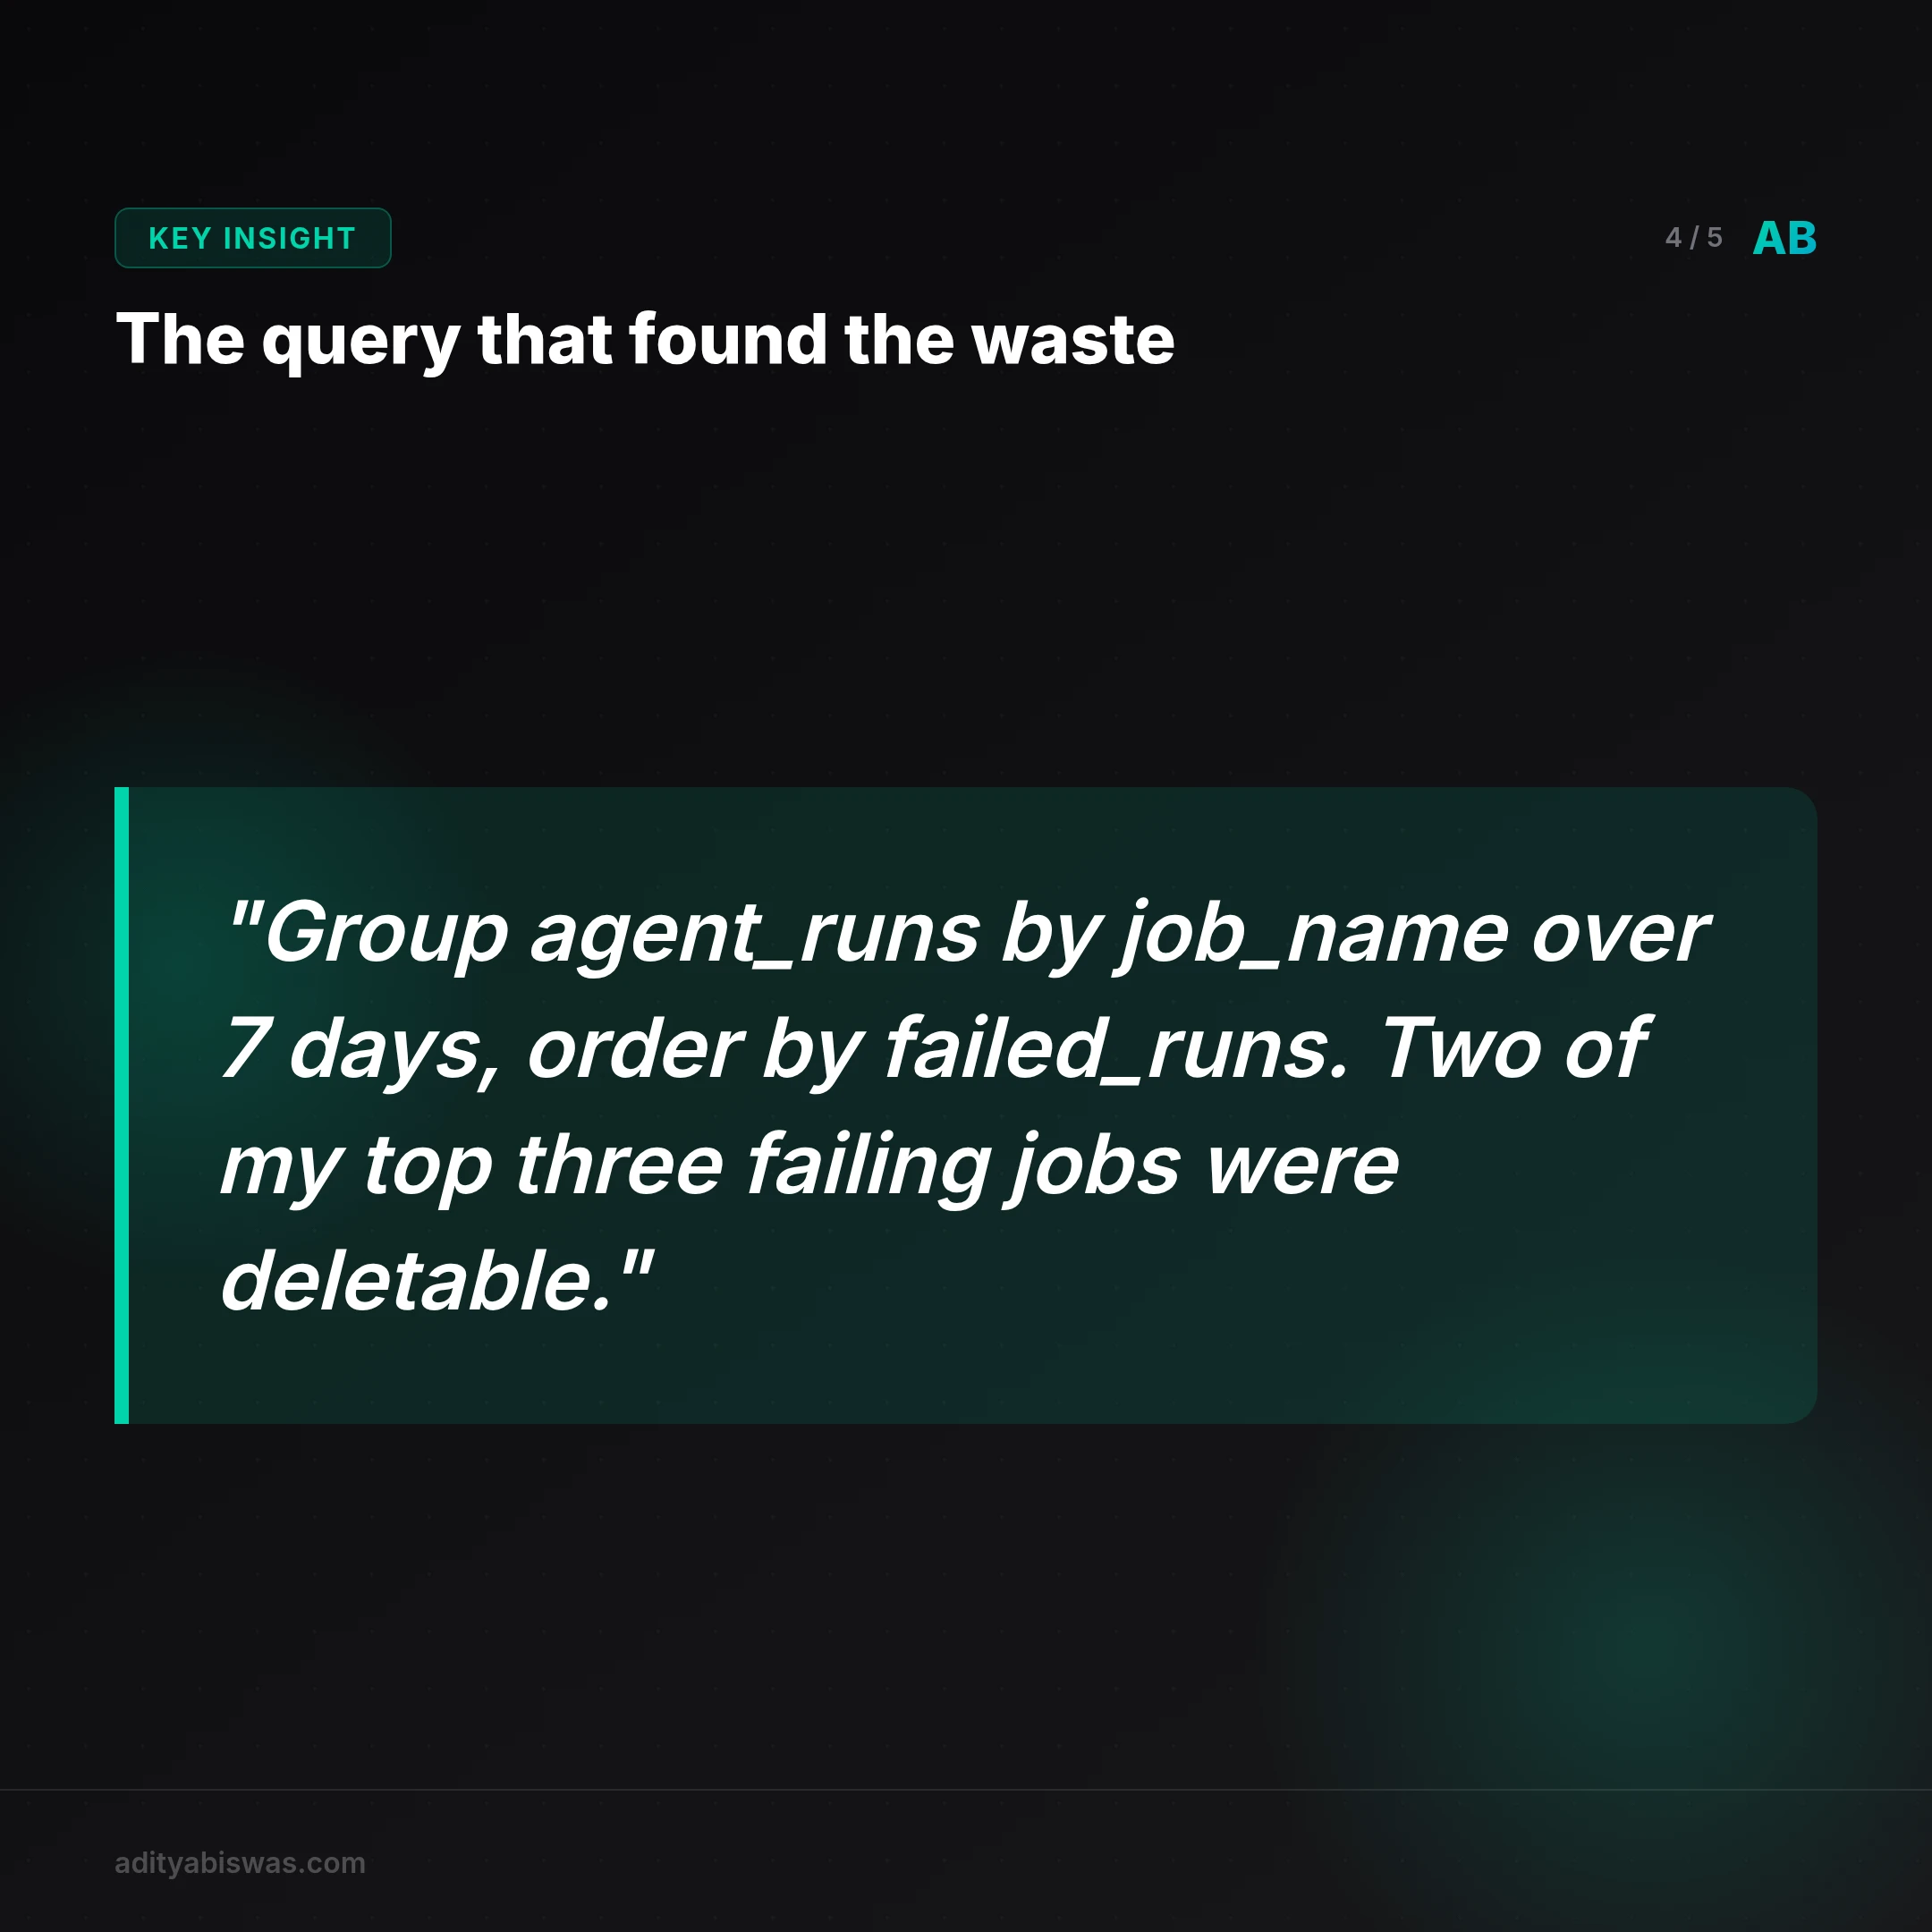
Third, I stopped trusting the success counter. My scheduler now records the terminal state of every run, not just whether the process exited zero. Here is the shape of the query I use to find the expensive failures:
SELECT
 job_name,
 COUNT(*) AS total_runs,
 SUM(CASE WHEN status <> 'ok' THEN 1 END) AS failed_runs,
 ROUND(
 100.0 * SUM(CASE WHEN status <> 'ok' THEN 1 END) / COUNT(*),
 2
 ) AS fail_pct
FROM agent_runs
WHERE started_at >= NOW() - INTERVAL '7 days'
GROUP BY job_name
ORDER BY failed_runs DESC;
That query is the whole intervention. Before it, I knew my total bill. After it, I knew which three jobs were responsible for most of the waste, and two of them were jobs I could simply delete. A job that fails often and nobody notices is a job nobody needs.
Measure cost per successful task, per job, before you touch a single model tier.
The remaining failures were mostly timeouts against a slow upstream. I raised the ceiling on those, capped retries at two instead of four, and added a hard per-run spend ceiling checked before the charge rather than reported after it. If a component can spend money, it needs a ceiling it cannot argue with.
The honest scoreboard
I am not going to claim a dramatic number here, because I do not have one yet. What I have is a different default question. When something looks expensive, I now ask which job failed, not which model is too pricey. That is a small shift in habit and a large shift in where the money goes.
The uncomfortable part is that reliability work is invisible. Nobody shares a screenshot of a reaper that found three orphan rows. Token price screenshots travel because they look like optimisation. But on a stack that runs unattended, the boring reconciliation loop is what keeps the whole thing safe to leave alone, and that is the actual product.
If you run agents on a schedule, run the query above this week. Look at failures per job before you look at your provider's pricing page. You will probably find that your cheapest model is not your problem.
What's Next
Two experiments I want to run before the next edition.
The first is a cost-per-successful-task dashboard. Right now I compute it by hand when I remember to. I want it as a single number on the Mission Control board, trended weekly, so a regression shows up as a line going the wrong way instead of a surprise on an invoice. That means joining my run ledger against the metering proxy I already use to stop generated code from running up a bill.
The second is a failure-class tag on every non-ok run. Timeout, upstream 5xx, malformed structured output, budget ceiling hit. Four buckets, chosen by hand from last week's logs. Once runs are tagged, I can see whether a fix moved the needle or just moved the failures into a different bucket. The published incident research suggests correctness failures hide inside healthy-looking availability numbers 23, and I want to know which bucket mine live in before I spend another week tuning prompts.
I am also going to test whether capping retries at two costs me any real completions. My guess is no, and that the third and fourth attempts were pure waste. If the guess is wrong, I will write about being wrong, which is cheaper than pretending I was right.
If you have run this comparison on your own stack, tell me what your cost-per-successful-task number looks like. I would rather compare notes than guess.
Related Reading
- Inference Pricing for Small Teams: What 3,065 Weekly Agent Runs… — Inference pricing for small teams isn't about per token rates. Retry and failure volume drive the bill. Here's where 3,065 weekly agent runs concentrate it.
- Cron job success but didn't run monitoring: 63 of 6,097 runs lied to… — A green exit code only proves a process ended. I audited 6,097 scheduled runs and found 63 that reported success while doing nothing at all.
- Per-Token vs Per-Task AI Pricing: What 10,573 Tool Calls Taught Me — My agent stack logged 10,573 tool calls across 230 tools in 7 days. No per token budget survives that. Here's why I'm designing for per task economics…
References

Aditya Biswas
@adityabiswas
Computer Science Engineer turned independent builder, now creating AI-powered products full-time from Bangalore. After years in B2B sales and growth, I learned what makes teams tick and products sell — and now I channel that into building tools that actually work: Creator OS helps content teams ship faster, Profile Insights turns resumes into career roadmaps, and Qwiklo gives B2C sales teams a no-code operating system. The twist? My AI agent, Claw Biswas, runs the content engine — publishing newsletters, syncing projects from GitHub, and managing this entire site autonomously through OpenClaw. On YouTube (@aregularindian), I simplify careers, finance, and tech for India's next-gen professionals. No fluff, no shady pitches — just clarity. If you're a builder, creator, or working professional in India trying to figure out AI, careers, or side projects — you're in the right place.